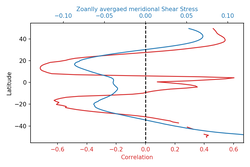
 We often need to create duel axis plot for comparing result with two variables. We can produce these plots using python matplotlib subplot and Axes.twinx(self)¶functions. Below, I demonstrate such a python code snippet to draw a duel axis plot having their axes aligned at x =0 or y=0 location (or wherever you like it to align). For the alignment, I've to using a user defined function. def align_xaxis(ax1, v1, ax2, v2): """adjust ax2 xlimit so that v2 in ax2 is aligned to v1 in ax1""" x1, _ = ax1.transData.transform((v1, 0)) x2, _ = ax2.transData.transform((v2, 0)) inv = ax2.transData.inverted() dx, _ = inv.transform((0, 0)) - inv.transform((x1-x2, 0)) minx, maxx = ax2.get_xlim() ax2.set_xlim(minx+dx, maxx+dx) fig, ax1 = plt.subplots() color = 'tab:red' ax1.set_xlabel('Correlation', color = color) ax1.set_ylabel('Latitude') ax1.plot(corr_xavg,lat_new,color=color) ax1.tick_params(axis='x', labelcolor=color) # ax2 = ax1.twinx() # instantiate a second axes that shares the same x-axis ax2 = ax1.twiny() # instantiate a second axes that shares the same y-axis color = 'tab:blue' ax2.set_xlabel('Zoanlly avergaed meridional Shear Stress', color=color) # we already handled the x-label with ax1 ax2.plot(tauxp_tavg_xavg,lat_new, color=color) ax2.tick_params(axis='x', labelcolor=color) align_xaxis(ax1,0,ax2, 0) fig.tight_layout() # otherwise the right y-label is slightly clipped plt.axvline(0.0, -50, 50, color='k', linestyle='--') # draw a vertical line at x = 0 plt.show() For the y-axis alignment, use this function: def align_yaxis(ax1, v1, ax2, v2): """adjust ax2 ylimit so that v2 in ax2 is aligned to v1 in ax1""" _, y1 = ax1.transData.transform((0, v1)) _, y2 = ax2.transData.transform((0, v2)) inv = ax2.transData.inverted() _, dy = inv.transform((0, 0)) - inv.transform((0, y1-y2)) miny, maxy = ax2.get_ylim() ax2.set_ylim(miny+dy, maxy+dy) Acknowledgement: This link helped to create the axis alignment function.
0 Comments
Leave a Reply. |
AuthorMahdi Hasan Archives
September 2023
Categories |
 RSS Feed
